Events
List View (Main Table)
-
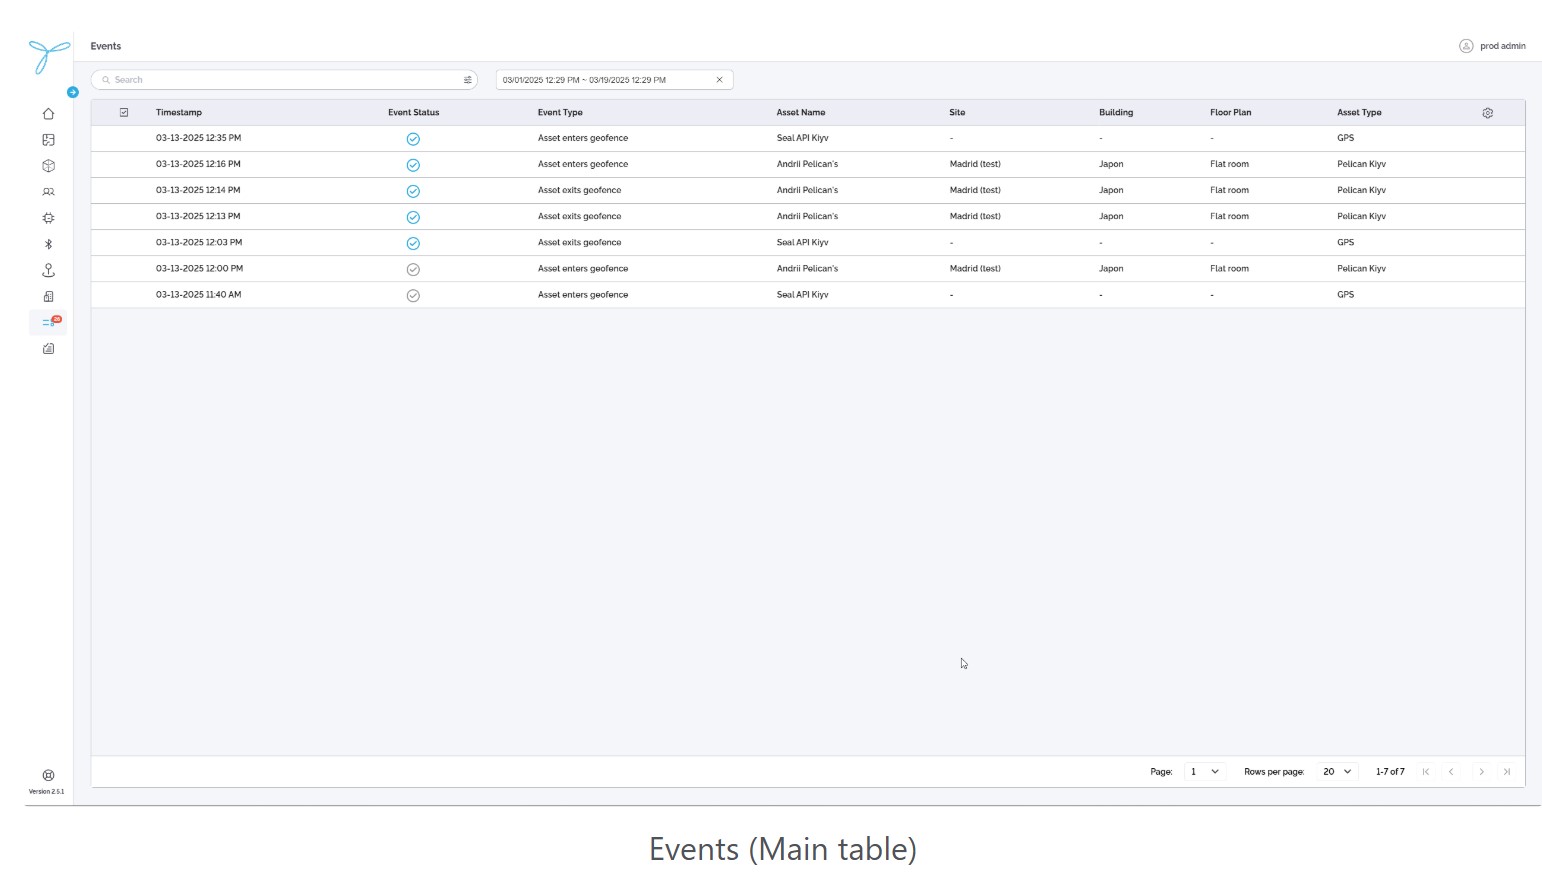
The table displays all events with the following default columns: Timestamp, Event Status, Event Type, Asset Name, Asset ID, Site, Building, Floor Plan, Event ID, Asset Type.
-
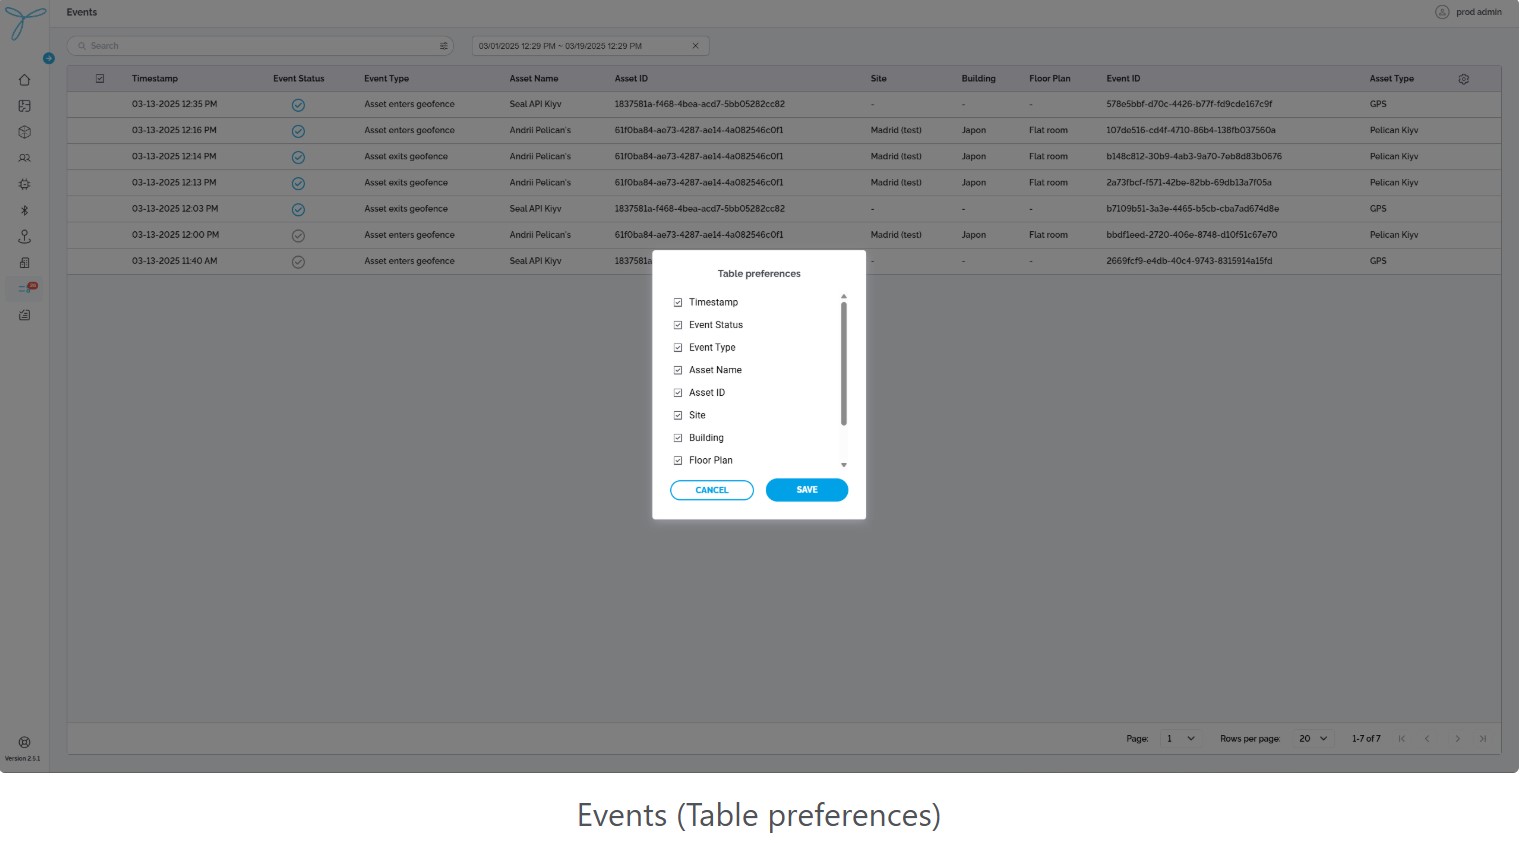
Column Configuration (Table Preferences):
- Click the gear icon to open the Table Preferences modal.
- Select which columns to show or hide (e.g., Timestamp, Event Status, Event Type, Asset Name, Asset ID, Site, Building, Floor Plan, Event ID, Asset Type).
- Columns can be rearranged by dragging, hidden by deselecting, but resizing is not supported.
- Click Save to apply changes; Cancel to discard.
-
Search and Filter:
-
Use the Search bar to find events by Asset Name.
-
Use the Timestamp Filter: Select a date range (e.g., 03/19/2025 12:31 PM - 03/19/2025 12:29 PM) to filter events within that period.
- Steps: Click the calendar icon, select the start and end dates/times, and apply the filter.
- Expectations: Displays only events within the selected time range.
-
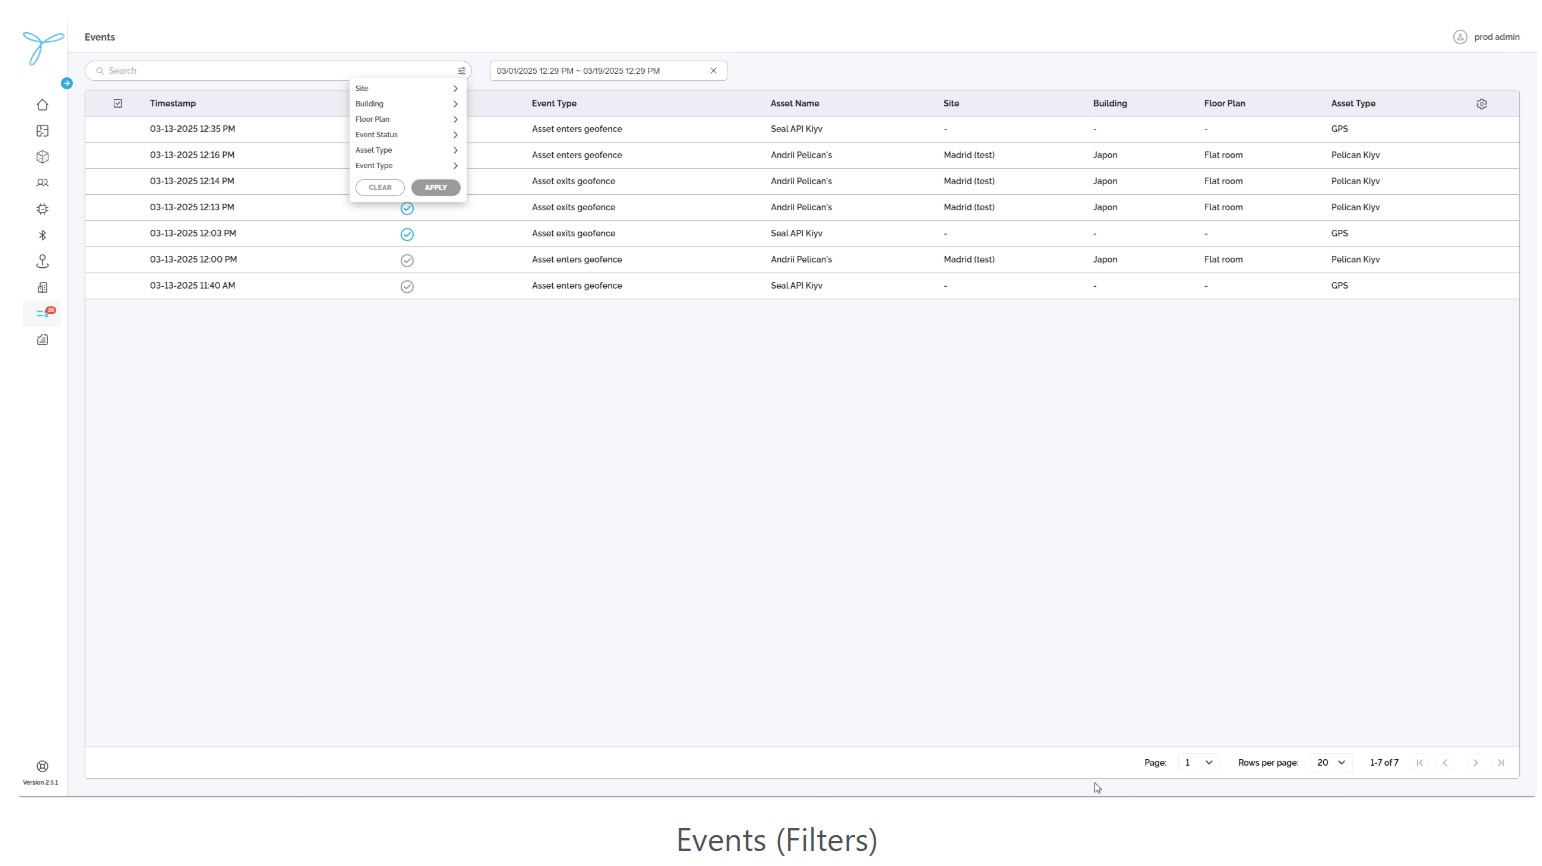
Use the Site filter dropdown to filter events by site (e.g., Madrid (test)).
- Steps: Click the filter icon, select a site, click Apply to filter, or Clear to reset.
- Expectations: Displays only events associated with the selected site.
-
Use the Building filter dropdown to filter events by building (e.g., Japon).
- Steps: Click the filter icon, select a building, click Apply to filter, or Clear to reset.
- Expectations: Displays only events associated with the selected building.
-
Use the Floor Plan filter dropdown to filter events by floor plan (e.g., Flat room).
- Steps: Click the filter icon, select a floor plan, click Apply to filter, or Clear to reset.
- Expectations: Displays only events associated with the selected floor plan.
-
Use the Event Status filter dropdown to filter events by status (e.g., checked/unchecked).
- Steps: Click the filter icon, select a status, click Apply to filter, or Clear to reset.
- Expectations: Displays only events matching the selected status.
-
Use the Event Type filter dropdown to filter events by type (e.g., Asset enters geofence, Asset exits geofence).
- Steps: Click the filter icon, select an event type, click Apply to filter, or Clear to reset.
- Expectations: Displays only events matching the selected type.


-
-
Actions:
- Click on an event row (e.g., “Asset enters geofence” for “Andril Pelican’s” at 03-13-2025 12:16 PM) to open the Event Details Screen.
-
Pagination: Adjust rows per page (e.g., 20) and navigate pages (e.g., 1 of 7) using the pagination controls at the bottom.
Event Details Screen
-
Access: Click on an event row in the Events list (e.g., “Asset enters geofence” for “Andril Pelican’s” at 03-13-2025 12:16 PM) to open the Event Details Screen.
-
Tabs and Sections:
-
Details Tab: Displays detailed information about the asset associated with the event.
-
History Tab: Shows the history of the asset (not detailed in this context).
-
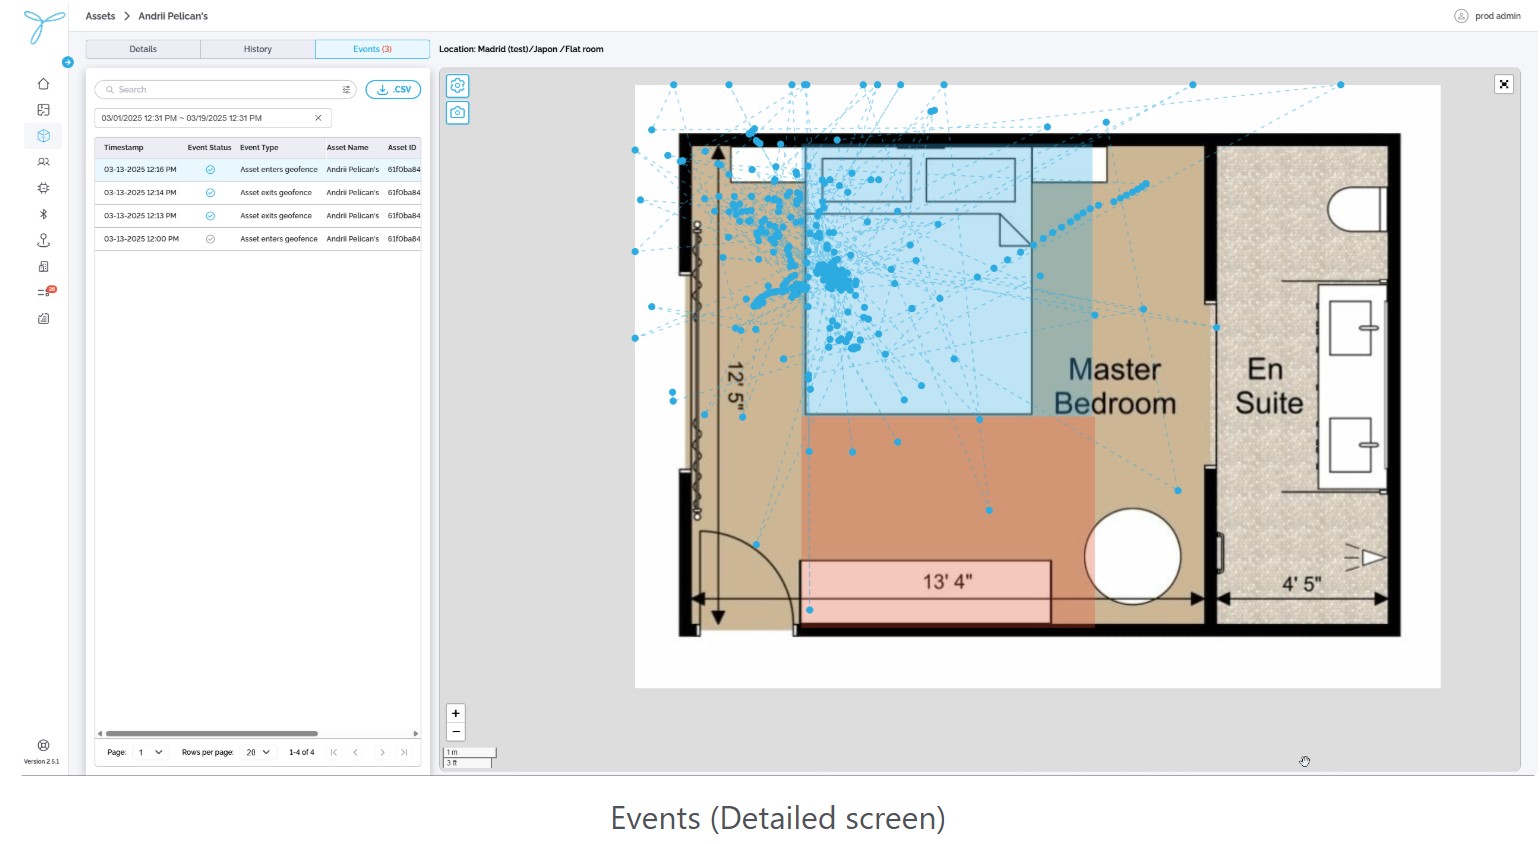
Events Tab: Displays a list of events for the selected asset (same as the main Events table).
- Columns: Timestamp, Event Status, Event Type, Asset Name, Asset ID.
- Filters: Same as the main Events page, including Timestamp (e.g., 03/19/2025 12:31 PM - 03/19/2025 12:31 PM).
- Export: Download the events list as a CSV file using the download button.
-
-
Map Interface:
-
Location Path: Displays the location path of the event (e.g., “Madrid (test) / Japon / Flat room”).
-
Floor Plan View: Shows the floor plan (e.g., “Flat room” in building “Japon” at site “Madrid (test)") with asset movement data.
- Blue dots represent asset positions over time, with dashed lines indicating movement directions.
- The floor plan includes labeled rooms (e.g., Master Bedroom, En Suite) with dimensions (e.g., 12'3” x 4'5").
-
Visibility Preferences:
-
Click the visibility preferences button to open the Visibility Preferences modal.
-
Options:
- Movement Directions: Toggle to show/hide dashed lines indicating the asset’s movement path.
- Tracks: Toggle to show/hide the blue dots representing the asset’s position history.
- Geofences: Toggle to show/hide geofence boundaries on the floor plan.
-
Click Apply to confirm changes; Cancel to discard.
-
-
Interactivity:
- Zoom in/out using the + and - controls.
- Export the current view as a screenshot using the camera icon.
-
Expectations: The map updates based on the selected visibility preferences, showing or hiding movement directions, tracks, and geofences as configured.

-
